Forecasting Weather Challenges
Weather may seem like a local issue we can't control, but reality is more complicated than that. While we don't control the weather itself, we have drastically reduced its impact on us through forecasting and preparation. A Tompkins County resident of the 1800s would marvel at the existence of a plausible five-day forecast, never mind radar images on a cell phone that can help indicate whether a thunderstorm will pelt one valley or the next.
Our weather forecasting infrastructure, however, is expensive and in many cases getting creaky. It depends on technologies, notably aviation, rocketry, and helium balloons, that may face resource limits in the future, as well as a short-term set of challenges created by failed satellite launches and tighter budgets.
Local Weather
Tompkins County weather is rarely dull, with substantial variations in temperature and precipitation from week to week and year to year. While Tompkins County is not regularly blasted by hurricanes or tornadoes, local weather is a complex set of intersections, dominated by continental weather coming from the west that mixes with arctic weather coming from the north and Atlantic weather coming from the south and sometimes east.
Although Ithaca has seen extreme temperatures of 103°F (1936) and -35°F (1934), most of the acute challenges in local weather come from precipitation. Before the completion of the Flood Control Channel in Ithaca, the city faced regular floods, and even today it experiences occasional issues related to ice jams. A 1935 flood caused problems across the county, even in Trumansburg [1], where debris blocked a bridge and created flooding in a place where it seemed impossible. 1972's floods accelerated the demise of local railroad infrastructure, while 1981 devastated the Village of Dryden. 2011 saw damage in Caroline, though Tompkins County dodged many worse issues to the east.
Although Tompkins County isn't in New York State's heaviest snow areas, blizzards have shut down the county every few decades, stranding residents and cutting off power. Ice storms periodically disrupt transportation and electrical distribution, as well as damaging trees and buildings.
Average annual snowfall in inches, Upstate New York (from NOAA). Tompkins County is in the 60-80 inch band. [2]
Tornadoes and windstorms do happen occasionally, with the Village of Dryden seeing tornadoes downtown in 1983 and 1996, and the Jersey Hill area having one last year. While these have been relatively weak tornadoes, powerful tornadoes do occasionally occur in the northeast [3].
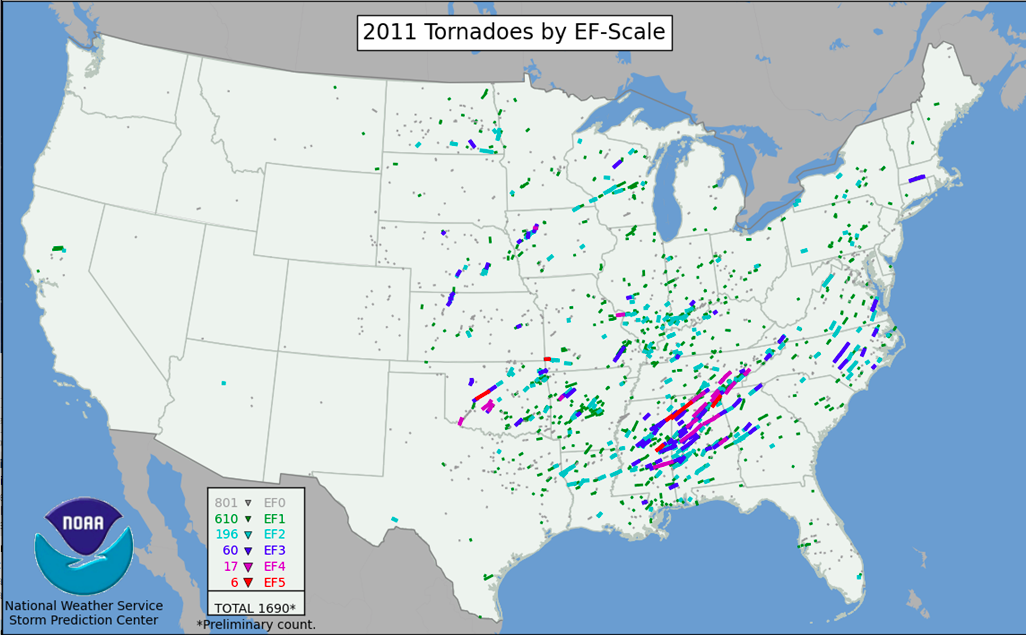
US tornadoes, 2011 (from NOAA) [4]
While the weather of spring 2012 may have seemed strange, odder and more damaging weather has happened in the past. May 23, 1925 saw 94 degrees in Buffalo, followed by ice and snow the next day, and harsh storms rolled across the northeast. Perhaps most troubling, however, was 1816's "Year without a Summer" when the massive volcanic eruption of Indonesia's Mount Tambora shrouded the planet in haze, and frosts were common throughout the summer, devastating crops.
Less dramatic circumstances can still cause problems for farmers, who depend on the weather for their livelihood. Crops need water, but too much water (or water at the wrong time) can create its own problems, both for plants and for the equipment used to manage them. Hailstorms can demolish crops and equipment, while late frosts in spring or early frosts in fall can wreak havoc on harvests.
Even relatively minor-seeming weather - fog, light rain, or a little bit of snow or ice - can have a major impact on travel safety, especially on local hills. Ithaca airport had to divert flights for a few weeks in March and April 2012 because a crystal needed for instrument navigation in cloudy or foggy weather was broken, but even simpler forms of transportation can become more complicated when weather is iffy.
The impact of climate change on day-to-day weather isn't clear yet, but added energy in the atmosphere can do more than warm it. More energy means more power for wind and storms, and it increases the possibility of events like that cold front of 1925. In the long term, diversions or droughts that cause changes in the water volumes of the Great Lakes could also change weather patterns here.
Forecasting: Collection, Communications, and Calculation
While we haven't learned to actually manage the weather, we have spent the last two hundred years taming our temperate climates by getting better at knowing what weather is coming when, preferably far enough in advance to take precautions if necessary. While it remains fairly difficult to precisely forecast how much precipitation will land where, or where in a possible storm tornadoes will form, meteorologists and their powerful tools have delivered better and better results over the last century or so.
Data collection is the first key to forecasting. The earliest "weather maps" were built using old observations, but the spread of reliable instruments and telegraph lines made daily station data collection possible by the time of the Civil War. Weather station reports today range from official Automated Surface Observing System (ASOS) installations, often at airports and National Weather Service (NWS) offices, to home stations that transmit their findings over the Internet.
Monitoring precipitation is important, but monitoring the impact of that precipitation on streams and rivers is also important for predicting flooding. In Tompkins County, the US Geological Survey maintains recording gauges on Six Mile Creek at Brooktondale and Bethel Grove, on Fall Creek in Forest Home, and on Cayuga Inlet at the lake.
Weather balloons add critical upper air observations. They are typically released twice a day from 900 stations around the world. Radiosondes [5] transmit data on pressure, temperature, and humidity for up to a few hours, and the path of the balloon indicates wind speed and direction. The balloons themselves are single use, rising until they pop. While about 20 percent of radiosondes are found and recovered, most disappear after a single use. At $100 for each radiosonde plus approximately $20 for the balloon and perhaps another $20 to fill it, individual balloons may seem relatively cheap, but they become expensive over time. Occasionally, as when Hurricane Irene was coming up the East Coast in 2011, the weather service uses them more than twice a day, but this is rare.
Weather satellites give meteorologists key overhead views of storms and normal weather. Typically satellites collect visual and infrared data, monitoring temperatures and water vapor. Satellites have made it possible to track hurricanes while they are still forming at sea, allowing for adequate warning. They also monitor solar weather, tracking changes in solar radiation and their impacts on earth's electromagnetic fields. For the United States, the key satellites are the geostationary GOES satellites. There are four functioning satellites in orbit at present, including one spare.
Airplanes both need weather information and generate weather information. While pilot reports have been important to forecasting since the early days of aviation, they were sporadic. The Aircraft Communications Addressing and Reporting System (ACARS) and temperature and wind sensosrs on planes send about 35,000 weather report messages per day in the United States, and about 130,000 per day world wide. These observations make a substantial difference in the quality of forecasting:
From September 11 to September 13 [2001], the FAA grounded aircraft across the United States. Without the benefit of the hourly aircraft observations, the 3-hour forecasts produced by NWS models became only as accurate as 12-hour forecasts normally are. [6]
A newer system, TAMDAR, pushes airplane-based automatic reporting systems further, with 425 aircraft providing approximately 5000 daily reports on temperature, pressure, winds, humidity, icing, and turbulence.
Ground-based radar serves a different purpose, tracking local storms in motion and providing detailed information on where they're going and the dangers they may pose. NEXRAD, the currently widespread weather radar, is deployed at National Weather Service sites around the US. In New York State, NEXRAD is deployed at Buffalo, Binghamton, Albany, and Montague. The NWS makes radar data available on the web and directly to private companies, which often assemble it into smooth maps that hide how it is built from multiple radar sources. NEXRAD has been especially critical in the Great Plains for tornado warnings, but it is also useful for monitoring all kinds of thunderstorm, snow, and wind events.
A wide variety of communications networks link these systems, including government networks as well as private and public commercial networks. Raw weather data from the government is freely available on the Internet, as is more-processed commercial data from vendors, often supported by advertising. A dedicated network of weather radio stations run by the National Oceanic and Atmospheric Administration (NOAA) makes reports and warnings available across the country, including in Ithaca, where station WXN59 broadcasts continuously.
Global data is also critical. Most nations share weather data freely, making it possible to build models of global weather that offer much greater long-term accuracy than models with sharp boundaries. While weather doesn't simply cross the Pacific from Siberia or China, weather data from those places can still enhance forecasting for the United States.
Processing this flood of data requires massive computing power, though perhaps compared with climate simulations or nuclear weapons simulations it isn't so massive. The National Weather Service maintains its own central models and distributes them to local offices, which issue their predictions (and warnings) based on the model and their understanding of local conditions. (The Binghamton NWS handles forecasting for Tompkins County.)
Fading Forecasting
The intricate networks of complex tools required for today's level of forecasting accuracy are difficult to maintain. Satellite launches and operations can cost millions of dollars and yet result in failure, and even the smaller components have their own difficulties. Some warnings today may point to further challenges to come in a more resource-constrained world.
Current Challenges
After decades of continuous weather forecasting improvements, American weather forecasting faces some difficult challenges today, even before considering issues of energy descent. These are often phrased competitively - "U.S. numerical weather prediction (NWP), and particularly our global prediction skill, lags between major international centers". [7] To some degree this is a question of priorities. As the article asks:
We spend this much money on a single jet fighter, but we can't invest this amount to greatly improve forecasts and public safety in the U.S.?
Weather forecasting in all of its growing complexity does not, however, seem to be an especially popular investment. Every decade or so reports emerge of resource shortages, cost overruns, and other complications. Weather Forecasting: Cost Growth and Delays in Billion-Dollar Weather Service is a typical example from 1991. Despite its more moderate-sounding title, the current Earth Science and Applications from Space: A Midterm Assessment of NASA's Implementation of the Decadal Survey [8] reports that:
the nation's Earth observing capability from space is beginning to wane as older missions fail and are not replaced with sufficient cadence to prevent an overall net decline. The committee found that the number of NASA and NOAA Earth observing instruments in space is likely to decline to as little as 25 percent of the current number by 2020...
as longrunning missions end and key new missions are delayed, lost, or canceled.
The projected loss of observing capability could have significant adverse consequences for science and society. The loss of observations of key Earth system components and processes will weaken the ability to understand and forecast changes arising from interactions and feedbacks within the Earth system and limit the data and information available to users and decision makers. Consequences are likely to include slowing or even reversal of the steady gains in weather forecast accuracy over many years and degradation of the ability to assess and respond to natural hazards and to measure and understand changes in Earth's climate and life support systems. The decrease in capability by 2020 will also have far-reaching consequences for the vigor and breadth of the nation's space-observing industrial and academic base... (page 2)
The challenges are basic, though the details are complicated:
a budget profile that is not sufficient to execute the decadal survey's recommended program. In addition, some of the survey-recommended missions have proved more challenging than anticipated, and others envisioned synergies that are not readily achieved via the suggested implementation. The ESD budget has been further strained as a result of mandates from Congress (e.g., the addition of the approximately $150 million TIRS [Thermal Infrared Sensor] to the Landsat Data Continuity Mission) and the interjection of administration priorities (e.g., the Climate Continuity missions) without the commensurate required funding. (page 4)
In particular:
Lack of reliable, affordable, and predictable access to space has become a key impediment to implementing NASA's Earth science program. Furthermore, the lack of a medium-class launch vehicle threatens programmatic robustness. (page 5)
Even on the ground, improving weather forecasting is no longer a strictly federal project. In Texas, better weather forecasting comes with a hefty local commitment [9]:
The near-ground radar system, which will supplement the current NEXRAD Doppler radar network, will provide faster scans, higher-resolution images and multiple overlapping views of storm cells, said Bill Bunting, chief meteorologist for the National Weather Service in Fort Worth....
CASA is footing the approximate $4 million cost of the initial eight radar systems.
Local entities are responsible for the first year's operating cost, $500,000; the cost is expected to decline in the second year.
$500,000 is still a small piece of a $40 million system, but localizing the cost of these services seems likely in an era where federal expenses of any kind are increasingly questioned.
Possible Future Challenges
Satellites are risky business under the best of circumstances, but resource constraints can wear on nearly every part of the weather forecasting system. Satellites themselves are an extremely visible component of our weather tracking systems, and their information may also have military value, so it is possible that those could continue while other pieces of the system break down.
Components of the technical network that produces today's weather forecasts face four major challenges:
Physical wear
Physical wear is a serious long-term challenge for weather station components but especially for things like stream gauges. Wear may not show itself as failure, but through diminished accuracy, requiring regular calibration.
Complex maintenance
Radar and communications systems are complex to build, but even when they're operational they need regular upkeep. In the case of satellites, "maintenance" often means "replacement".
Questions of distribution (and cost distribution)
The National Weather Service provides information to the public for free, but also provides data feeds to the many commercial weather providers. It's a complex and ever-changing relationship in which the NWS provides foundation information but "specialized services" are handled by industry. Current expectations of things like free radar maps that have been combined and reprocessed depend on the health of a variety of commercial models.
Changes in aviation
As airlines streamline operations, consolidating flights to reduce the number of empty seats and cutting service to airports that don't meet their profitability expectations, fewer flights will yield less weather data from fewer locations.
It is, of course, possible that Americans will demand better weather information and the federal government will make it a higher priority even if energy costs climb, but it is hard to forecast that. There are scenarios - More satellites! Bigger computers! More ground stations! - in which weather forecasting quality could improve, but given the kinds of constraints TCLocal tries to prepare for, this is unlikely.
Weather forecasts probably won't go away, of course. If parts of the system fade, the quality of the forecasts will decline, especially longer-term forecasts. Rough seasonal forecasts based on ocean currents (El Niño and similar) may continue to be useful, however, so long as the data continues to be collected. Some pieces are more at risk than others - for example, Doppler radar is constantly a matter of life and death on the Great Plains, where tornadoes are common, so it's not hard to imagine a resource-constrained NWS moving key resources where they're most needed. For radar, that isn't here.
Impacts and Alternatives
If weather forecast quality declines, the simplest general approach will be to prepare for more weather danger than may come to pass. Forecasts have in many ways tamed a climate that already can lurch from blazing hot to freezing cold by letting us figure out what's going to happen before it gets here. If that luxury becomes less reliable, residents will have to sacrifice efficient use of time and resources to avoid catastrophes.
Many of the changes suggested here also apply if climate change should produce weather more extreme and changeable than we already have. Weather forecasting is largely a tool we use to moderate the effects of weather, so declining weather forecast quality is in some ways produces impacts equivalent to increasing extremes in actual weather. Great weather forecasting can ease the impact of many aspects of extreme weather, while poor weather forecasting makes it harder to avoid even the impact of our usual weather.
Traveling on the Weather's Schedule
On January 24, 1945, schoolbuses left Dryden Central School early to try to get students home in the face of a blizzard. All but one couldn't get through, however, and 61 students returned to the school for three days. When they finally went home, it was in open horse-drawn sleighs, not the buses or even the plows that couldn't get through the snow.
Today, that experience is hard to imagine. A school superintendent who knew snow was coming but hoped to avoid an extra snow day could easily have changed plans earlier in the day. Although radar isn't great for identifying the rate at which snow falls, it certainly makes clear if a storm is moving more quickly than planned, and provides some extra margin to get students home. We can plan our activities around weather forecasts, and change them in real time based on constantly updating data.
Without that data, however, working or traveling outside is more complicated. Cars and trucks with wheels perform much better on smooth dry asphalt, especially on the hills of Tompkins County. People in charge of wheeled transportation - a highway superintendent trying to keep roads open, a superintendent of schools commanding a fleet of buses, or a trucking company carrying gravel - will have harder times developing plans of action. The odds of a mistake climb dramatically and caution becomes more prudent.
Similarly, people can choose to travel less. That could increase the value of local shops, which could be more convenient than a drive to a bigger, farther location when snow seems possible. Those who have the power to choose transportation network designs - school districts in particular, but also municipalities and some kinds of businesses - might opt for less centralization and shorter trips. By increasing the overall cost of travel, weather uncertainty reduces the advantages of centralization.
Another option, of course, is to choose modes of transport that are less risky. Pedestrians don't always enjoy ice and snow (or even rain), and shouldn't wander the countryside in a blizzard or throw aside their canes to dance on the icy sidewalk, but they have more options. Snowshoes, skis, and traction devices for shoes are all easier to apply and remove than chains on vehicle tires. Sleighs and snowmobiles provide another option, though not necessarily an option that works at large scale.
Concentrating and Protecting Fragility
While large-scale blizzards create problems across large areas, weather forecasting helps minimize the impact of many smaller problems. Hail and frost warnings may only affect a small area or a small set of projects, but defending against either is difficult on a large scale. A hail warning might, for example, tell individuals to park vehicles inside or protect key outdoor objects, while a frost warning might be a sign to protect seedlings or fruits with a cloche or similar wrap. Without those warnings, people will have to guess what might be coming based on a broader picture of the weather.
Instead of cursing warnings that weren't issued, a simpler approach concentrates fragile items and protects them. For vehicles, this is the classic garage or carport. For plants, it could be a greenhouse, but it could also be a much lighter high tunnel that can cover large areas at low cost. On a smaller scale, it could even be a row cover that protects smaller plants with metal frames and translucent covers. None of these are cheap, but all of them bring other advantages.
In some cases, changing the style of agriculture or gardening may also be appropriate. While most crops are grown in open fields to maximum sun exposure, some crops, notably currants and gooseberries, can thrive in light forests. Food forests and silvipasture approaches may be more resilient against unexpected or more severe weather than traditional approaches.
Concentrating tasks that need attention and connecting them to people who can help is another option. Medieval buildings that combined barn, stable and house for shared convenience (and warmth) might seem extreme, but such an arrangement can be practical. A simpler approach is placing housing near buildings, notably barns, that need regular human visitors. In many northern areas the connections between buildings are roofed or even turned into hallways, protected from the risks of wind, rain, and snowdrifts.
Large-scale Protection
Past flooding drove the construction of two major public works meant to reduce the dangers inherent in Tompkins County's system of streams. The Flood Control Channel in Ithaca was built to reduce the impact of regular flooding in downtown Ithaca, and the Crispell Dam on Virgil Creek in southeast Dryden does the same for the Villages of Dryden and Freeville and for Fall Creek generally. Around the county, many stream stabilization projects direct water away from places it would cause trouble.
These massive projects have had substantial effects. The Crispell Dam slowed the rate of flow in Fall Creek at a critical moment in September 2011, and the Flood Control Channel has, with some minor exceptions, kept dry even areas that used to regularly flood. The Flood Control Channel has even made development in formerly wet areas like Southwest Park and the current Ithaca High School seem more plausible.
While these public works can substantially reduce the uncertainty created by declining forecasts or more severe weather, they also cost a lot to build and maintain. The Flood Control Channel in particular just received $13 million for dredging, a project that is already far behind an ideal schedule. The dam and stream projects also require regular maintenance as well, though the work is smaller and less specialized.
Other kinds of public works can also make a substantial difference. The floods in Trumansburg in 1935 and Dryden in 1981 shared a common culprit: bridges that filled with debris. While larger bridges with designs that are harder to plug are more expensive, they may be an ever more necessary part of shared infrastructure. (They also wash out less frequently.)
Applying Microclimates
Because of Tompkins County's varied terrain and water features, weather conditions can vary drastically over the course of a mile or even a few hundred feet. Some of those microclimates have much calmer weather than the rest of the county, but may not be especially useful because they're in the bottoms of mostly shady gorges. Elevation, exposure, and orientation all create different situations that produce significantly different weather.
Closer study of different areas could yield a map of places that are more and less prone to frost damage on cold nights, likely to receive more or less precipitation (and especially runoff), and which get more or less wind. On a broad scale, the 2011 version of the US Department of Agriculture's climate zone map shows areas along the lake and at the lake's elevation as Zone 6a, with a minimum winter temperature of -10°F, while the rest of the county is at Zone 5b, minimum winter temperature of -15°F.
Identifying different microclimates is sometimes possible through simple observation over time. People definitely talk about colder valleys and places where it's harder to grow fruit trees. More detailed mapping, however, might be a good project to start while the full set of weather tools is still available. Once identified, that knowledge would be a good complement to things like the Soil Type Maps when farmers need to decide what kinds of crops to plant where.
Local Data, Local Warnings
Today, weather warnings are issued by regional NWS offices. While those warnings can be extremely useful, they come with natural limits because of the limited information about extremely local conditions. Stream gauges, for example, are largely downstream of places where flooding might occur.
Local watches could become a regular part of government again. During the 1935 flooding, a local watch on the Dryden Lake dam reported concerns about a break. None occurred, and some people were unhappy about the false alarm, but that's information that the weather service can't really provide. Certain key points with aging infrastructure or a dangerous history may be especially worth watching and monitoring.
Recommended Reading
The Ultimate Guide to American Weather, by Jack Williams (2009), for an overview of current forecasting.
Warnings, by Mike Smith (2010) on how warnings and related technology evolved.
Air Apparent, by Mark Monmonier (1999), on how weather forecasting came to be.
Eric Sloane's Weather Almanac (reprint, 2005) for a look back at weather lore by a noted antiquarian who also happened to be a Navy meteorologist.
The 2012 Ithaca Weather Calendar, for local data. The 2013 version will likely include new records.
Basic Spotters' Field Guide, the National Weather Service introductory guide for local weather spotters.
Notes
[1] - "Home Movie of Trumansburg New York Flooding 1935." http://www.youtube.com/watch?v=Dt7mNDxj_5o
[2] - "Average Seasonal Snowfall Over the Eastern Great Lakes Region." http://www.erh.noaa.gov/er/buf/lakeffect/snowseason.html
[3] - "Tornado crosses NYS Thruway." http://www.youtube.com/watch?v=8pWkmTVbqcA
[4] - http://www.spc.noaa.gov/wcm/annualtornadomaps/.
[5] - "NWS Radiosonde Observations - Factsheet."http://www.erh.noaa.gov/gyx/weather_balloons.htm
[6] - Williams, Jack. The Ultimate Guide to America's Weather, 138.
[7] - Mass, Cliff. "Lack of Computer Power Undermines U.S. Numerical Weather Prediction (Revised)." http://cliffmass.blogspot.com/2012/04/us-has-fallen-behind-in-numerical.html
[8] - Earth Science and Applications from Space: A Midterm Assessment of NASA's Implementation of the Decadal Survey. https://download.nap.edu/catalog.php?record_id=13405
[9] - Campbell, Steve. "New weather radar better tracks violent storms." http://www.standard.net/stories/2012/03/19/new-weather-radar-better-tracks-violent-storms